by Michael D. Robbins
Director, Public Safety Project, PublicSafetyProject.org
March 3, 2014
Updated and expanded March 6, 2014.
This is the wrong time to raise taxes and fees on residents and businesses in El Segundo, for multiple reasons.
First, the existing three-year City employee union contracts are expiring later this year, and the City Council will negotiate new union contracts later this year after the April 8, 2014 City election. Raising taxes and fees before then will greatly weaken the City Council’s bargaining position with the unions, especially the politically active and extremely aggressive firefighter and police unions, which are the primary cause of the City’s financial problems.
Second, Mayor Bill Fisher and Councilmembers David Atkinson and Marie Fellhauer have claimed that the City’s financial problems are largely due to El Segundo receiving a lower percentage of the property taxes generated from property in the City than other cities in California receive.
That claim is false for multiple reasons.
The percentage of total property tax revenue generated in El Segundo that the City receives has not changed in many years, and the last time it changed, it went up due to the extraordinary efforts of Mayor Carl Jacobson. In fact, although El Segundo gets about 6.2% of the property tax revenues generated by property in the city, compared to the average of 11% for all 88 cities in Los Angeles County, El Segundo property values are much higher than the values in many other cities. The higher property values in El Segundo help compensate for the lower than average percent of property tax revenue allocated to the City of El Segundo.
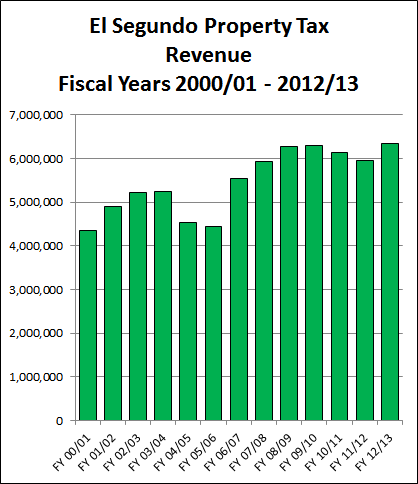
But most striking is the fact that the City is receiving the highest amount of property tax revenues it has received in any year since fiscal year 2000/2001, and probably in the City’s entire history, as shown by the bar chart below. The FY 2012/2013 property tax revenue is at a record high of $6,332,163 – up by 46% and $1,994,509 above FY 2000/2001 property tax revenue. Property tax revenue has increased in 9 of the last 13 fiscal years, with an average yearly increase of 3.6% and $166,209.

Mayor Fisher and Councilmembers Atkinson and Fellhauer have repeatedly berated El Segundo residents for not paying enough property taxes. City residents paid about $20,770,813 in property taxes in FY 2012/2013, which is about 20.9% of the total, of which $1,287,790 came back to the City (about 6.2%). The 20.9% figure is not surprising given that only about 25% of the city’s land area is residential property and about 75% is industrial and commercial, as shown in the aerial photograph with color overlays showing residential in yellow, the Chevron El Segundo Oil Refinery property in blue, and all other industrial and commercial zoned property in the city in red.

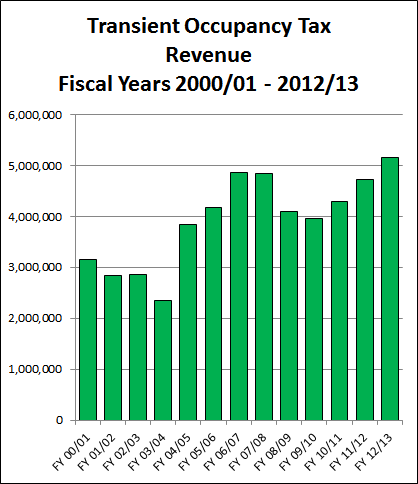
Also, the hotel transient occupancy tax (TOT, or “bed tax”) revenue is at record high levels, as shown in the second bar chart below. Much of this increase is likely due to new hotels in El Segundo, i.e., growing the business and tax base. So why punish hotels in El Segundo and discourage this growth by raising their TOT taxes by 25% and nearly doubling all their UUT taxes to pay for greatly excessive past and future firefighter and police union and manager pay raises and pension increases?

All of the tax revenue used for this analysis and the bar charts below came from City of El Segundo official public record documents that I requested under the California Public Records Act, California Government Code §6250 et seq. Click HERE to download a 1.53 MB PDF file containing the source data. I will provide links to a Microsoft Excel spreadsheet file soon.
So why is El Segundo having budget problems? Because of the wildly excessive and unsustainable pay raises that also increased pension costs to the point that El Segundo firefighters and police employees have been getting paid total compensation of about $150,000 to more than $330,000 per individual per year, and the City has been paying about $40,000 to more than $80,000 in CalPERS pension contributions per individual firefighter and police officer per year. Existing firefighter and police employees get up to 90% of their single highest year salary as their annual CalPERS pension income. So every wildly excessive pay raise has increased the cost of their pensions to the City.
The firefighter and police unions have endorsed and campaigned for City Council candidates, contributing thousands of dollars to their political campaigns and getting millions of excess taxpayer dollars per year in return. This has got to stop. It is now time to take back some of that wildly excessive compensation from the firefighter and police unions, not continue to give them excessive pay raises and a guarantee of no layoffs as in the current three-year union contracts.
Raising taxes and fees to give even bigger pay raises and pension increases to over-compensated politically active firefighter and police union members is immoral and counter-productive.
The following table provides the data used to generate the Property Tax Revenue bar chart, together with additional data. Each fiscal year starts on October 1 and ends on September 30 of the following calendar year. Thus, FY 2012/13 starts on October 1, 2012 and ends on September 30, 2013.
| Fiscal Year | Property Tax Revenues | Increase from FY 2000/01 | Pct Increase from FY 2000/2001 | Change from Prior FY | Pct Change from Prior Year |
| 2000/01 | 4,337,653.88 | ||||
| 2001/02 | 4,908,914.16 | 571,260.28 | 13.17 | 571,260.28 | 13.17 |
| 2002/03 | 5,214,911.38 | 877,257.50 | 20.22 | 305,997.22 | 6.23 |
| 2003/04 | 5,235,745.13 | 898,091.25 | 20.70 | 20,833.75 | 0.40 |
| 2004/05 | 4,523,477.13 | 185,823.25 | 4.28 | -712,268.00 | -13.60 |
| 2005/06 | 4,441,985.70 | 104,331.82 | 2.41 | -81,491.43 | -1.80 |
| 2006/07 | 5,544,221.23 | 1,206,567.35 | 27.82 | 1,102,235.53 | 24.81 |
| 2007/08 | 5,919,766.60 | 1,582,112.72 | 36.47 | 375,545.37 | 6.77 |
| 2008/09 | 6,267,592.67 | 1,929,938.79 | 44.49 | 347,826.07 | 5.88 |
| 2009/10 | 6,291,147.99 | 1,953,494.11 | 45.04 | 23,555.32 | 0.38 |
| 2010/11 | 6,125,246.62 | 1,787,592.74 | 41.21 | -165,901.37 | -2.64 |
| 2011/12 | 5,946,167.09 | 1,608,513.21 | 37.08 | -179,079.53 | -2.92 |
| 2012/13 | 6,332,163.33 | 1,994,509.45 | 45.98 | 385,996.24 | 6.49 |
| AVERAGE | 5,468,384.07 | 1,224,957.71 | 28.24 | 166,209.12 | 3.60 |
The following table provides the data used to generate the Hotel Transient Occupancy Tax Revenue bar chart, together with additional data. Each fiscal year starts on October 1 and ends on September 30 of the following calendar year. Thus, FY 2012/13 starts on October 1, 2012 and ends on September 30, 2013.
| Fiscal Year | Transient Occupancy Tax Revenue | Increase from FY 2000/01 | Pct Increase from FY 2000/2001 | Change from Prior FY | Pct Change from Prior Year |
| 2000/01 | 3,162,936.38 | ||||
| 2001/02 | 2,848,811.51 | -314,124.87 | -9.93 | -314,124.87 | -9.93 |
| 2002/03 | 2,866,810.77 | -296,125.61 | -9.36 | 17,999.26 | 0.63 |
| 2003/04 | 2,357,942.15 | -804,994.23 | -25.45 | -508,868.62 | -17.75 |
| 2004/05 | 3,849,782.63 | 686,846.25 | 21.72 | 1,491,840.48 | 63.27 |
| 2005/06 | 4,186,056.04 | 1,023,119.66 | 32.35 | 336,273.41 | 8.73 |
| 2006/07 | 4,862,164.67 | 1,699,228.29 | 53.72 | 676,108.63 | 16.15 |
| 2007/08 | 4,842,887.26 | 1,679,950.88 | 53.11 | -19,277.41 | -0.40 |
| 2008/09 | 4,109,580.93 | 946,644.55 | 29.93 | -733,306.33 | -15.14 |
| 2009/10 | 3,954,416.24 | 791,479.86 | 25.02 | -155,164.69 | -3.78 |
| 2010/11 | 4,301,696.26 | 1,138,759.88 | 36.00 | 347,280.02 | 8.78 |
| 2011/12 | 4,735,584.53 | 1,572,648.15 | 49.72 | 433,888.27 | 10.09 |
| 2012/13 | 5,156,079.60 | 1,993,143.22 | 63.02 | 420,495.07 | 8.88 |
| AVERAGE | 3,941,134.54 | 843,048.00 | 26.65 | 166,095.27 | 5.79 |


 El Segundo Police Officers' Association (ESPOA) Exposed